Comprehensive Business Solutions Tailored For You

Unlock your business potential with our expert consulting and innovative solutions.

Data Analytics & Visualizations

Transform data into actionable insights for growth.

Boost your brand with effective digital products.

Creative designs that captivate and engage audiences.

Digital Marketing & Informative Materials
Graphic Design
Management and Operations Consulting
Digital Transformation Consulting

Utilize data-driven approaches to boost productivity and optimize processes.

Modernize technology, processes, and culture to stay competitive.

Your Partner in Business Success

At Arq Logic, we specialize in providing comprehensive business solutions, including data analytics, visualization, digital products, digital transformation consulting, management and strategy consulting, graphic design services, etc. tailored to meet your unique needs and drive your success.

Empowering Your Business Growth
Innovative Solutions for You

Our experts are dedicated to transforming your business challenges into opportunities through insightful analytics, streamlining processes and products, and stunning designs, ensuring you stand out in a competitive market.

Comprehensive Business Solutions

We provide expert consulting, data analytics, digital transformation, digital transformation, management & operations consulting and graphic design services for businesses.
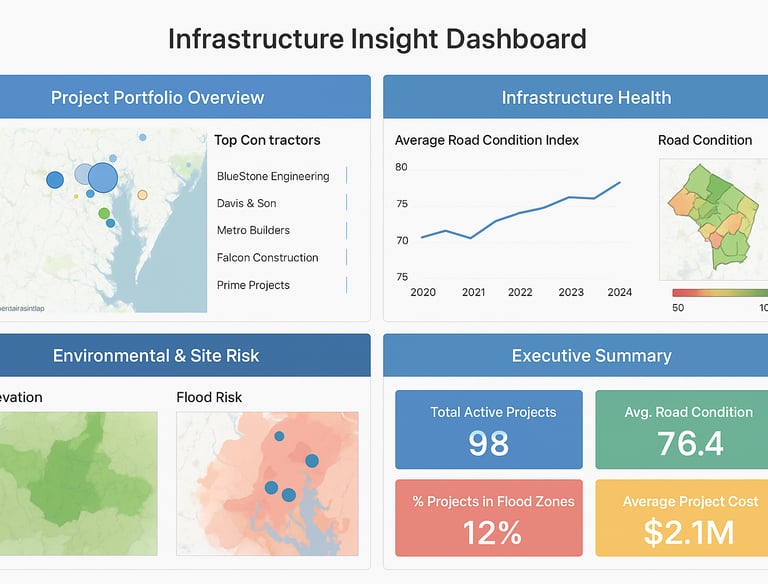
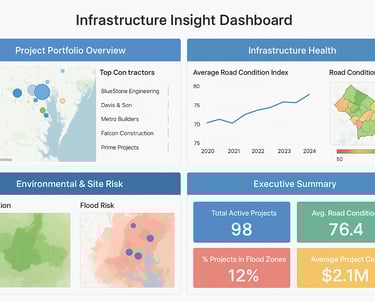
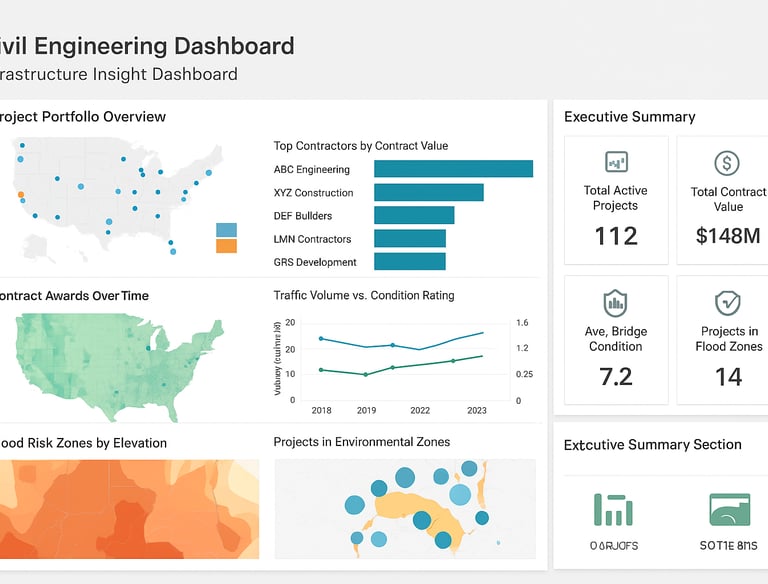
Data Analytics, Survey and Visualization Services
An abstract, pastel-colored, 3D-rendered representation of data analysis and search engine optimization (SEO). The image features a computer interface with various analytics symbols, including a magnifying glass, bar charts, pie charts, and a search bar with the text 'SEO'. Surrounding the interface are different objects such as a potted plant, a cup with a saucer, and a megaphone, all placed on a light green background.

Transform your data into actionable insights with our expert analytics and visualization solutions.

A computer screen displaying analytics dashboards with various charts, including a line graph on the left and a cohort analysis table on the right. The table is populated with different shades of blue, indicating varying levels of user activity over several weeks. Text labels and numbers detail user retention statistics.
four assorted books
four assorted books
Digital Product Solutions

Enhance your online presence and reach your target audience and beyond.

Creative graphic design services that elevate your brand and engage your audience effectively.

Graphic Design Services
Digital Transformation Consulting
Management and Operations Consulting

Transform your data into actionable insights with our expert analytics and visualization solutions.

We help guide strategic planning, organizational restructuring, and performance improvement.

Gallery

Explore our diverse solutions in business consulting and design.

A graphic with text reading 'Exploring Opportunities for D2C Startups in the Post-COVID-19 World.' It features a target with an arrow, a computer monitor displaying an upward graph, a calendar, a rocket icon, and a clipboard with colorful sticky notes.
A digital dashboard displaying various analytics charts and graphs. There is a line graph showing user engagement over time on the left, a section with total revenue marked as $74K, and bar charts illustrating user statistics by region. The central section highlights users in the last 30 minutes, focusing on different countries such as the United States, Canada, India, Pakistan, and Brazil.
A promotional banner with a bold red background features the text 'Data has a better idea' in large white letters. Above the text, the word 'HIVERY' is printed along with a stylized logo resembling a beehive. The background also includes a pattern of blue circles and dots, giving a digital or technological feel. In the surrounding area, there's a partial view of a desk and some office supplies.

If you’re looking for a consulting partner who genuinely cares about your success and delivers real, measurable results, I highly recommend this team. I’m forever grateful for their expertise and commitment.

John Doe

A conference room setting with several laptops on a large table, each being used by a person. A large screen displays a blue interface with the text 'Generate ad creatives from any website with AI'. A stainless steel water bottle and a conference phone are also visible on the table.

★★★★★